Highlights
- Detecting elephant rumbles in raw field audio, to power anti-poaching sensor networks that run for months on a single battery in dense forest.
- Two research questions back to back: which architecture actually hears a rumble reliably, then how far that model can shrink without losing accuracy.
- 99.2% accuracy at 2.48 MB, a 3.94x compression that makes continuous, on-device detection possible on a battery-powered sensor.
Stack: Python, PyTorch, Optuna, Singularity, MobileNetV2, ResNet18, ResNet50, LSTM, San Diego Supercomputer Center's Expanse cluster.
Overview · How it works · Results
Overview
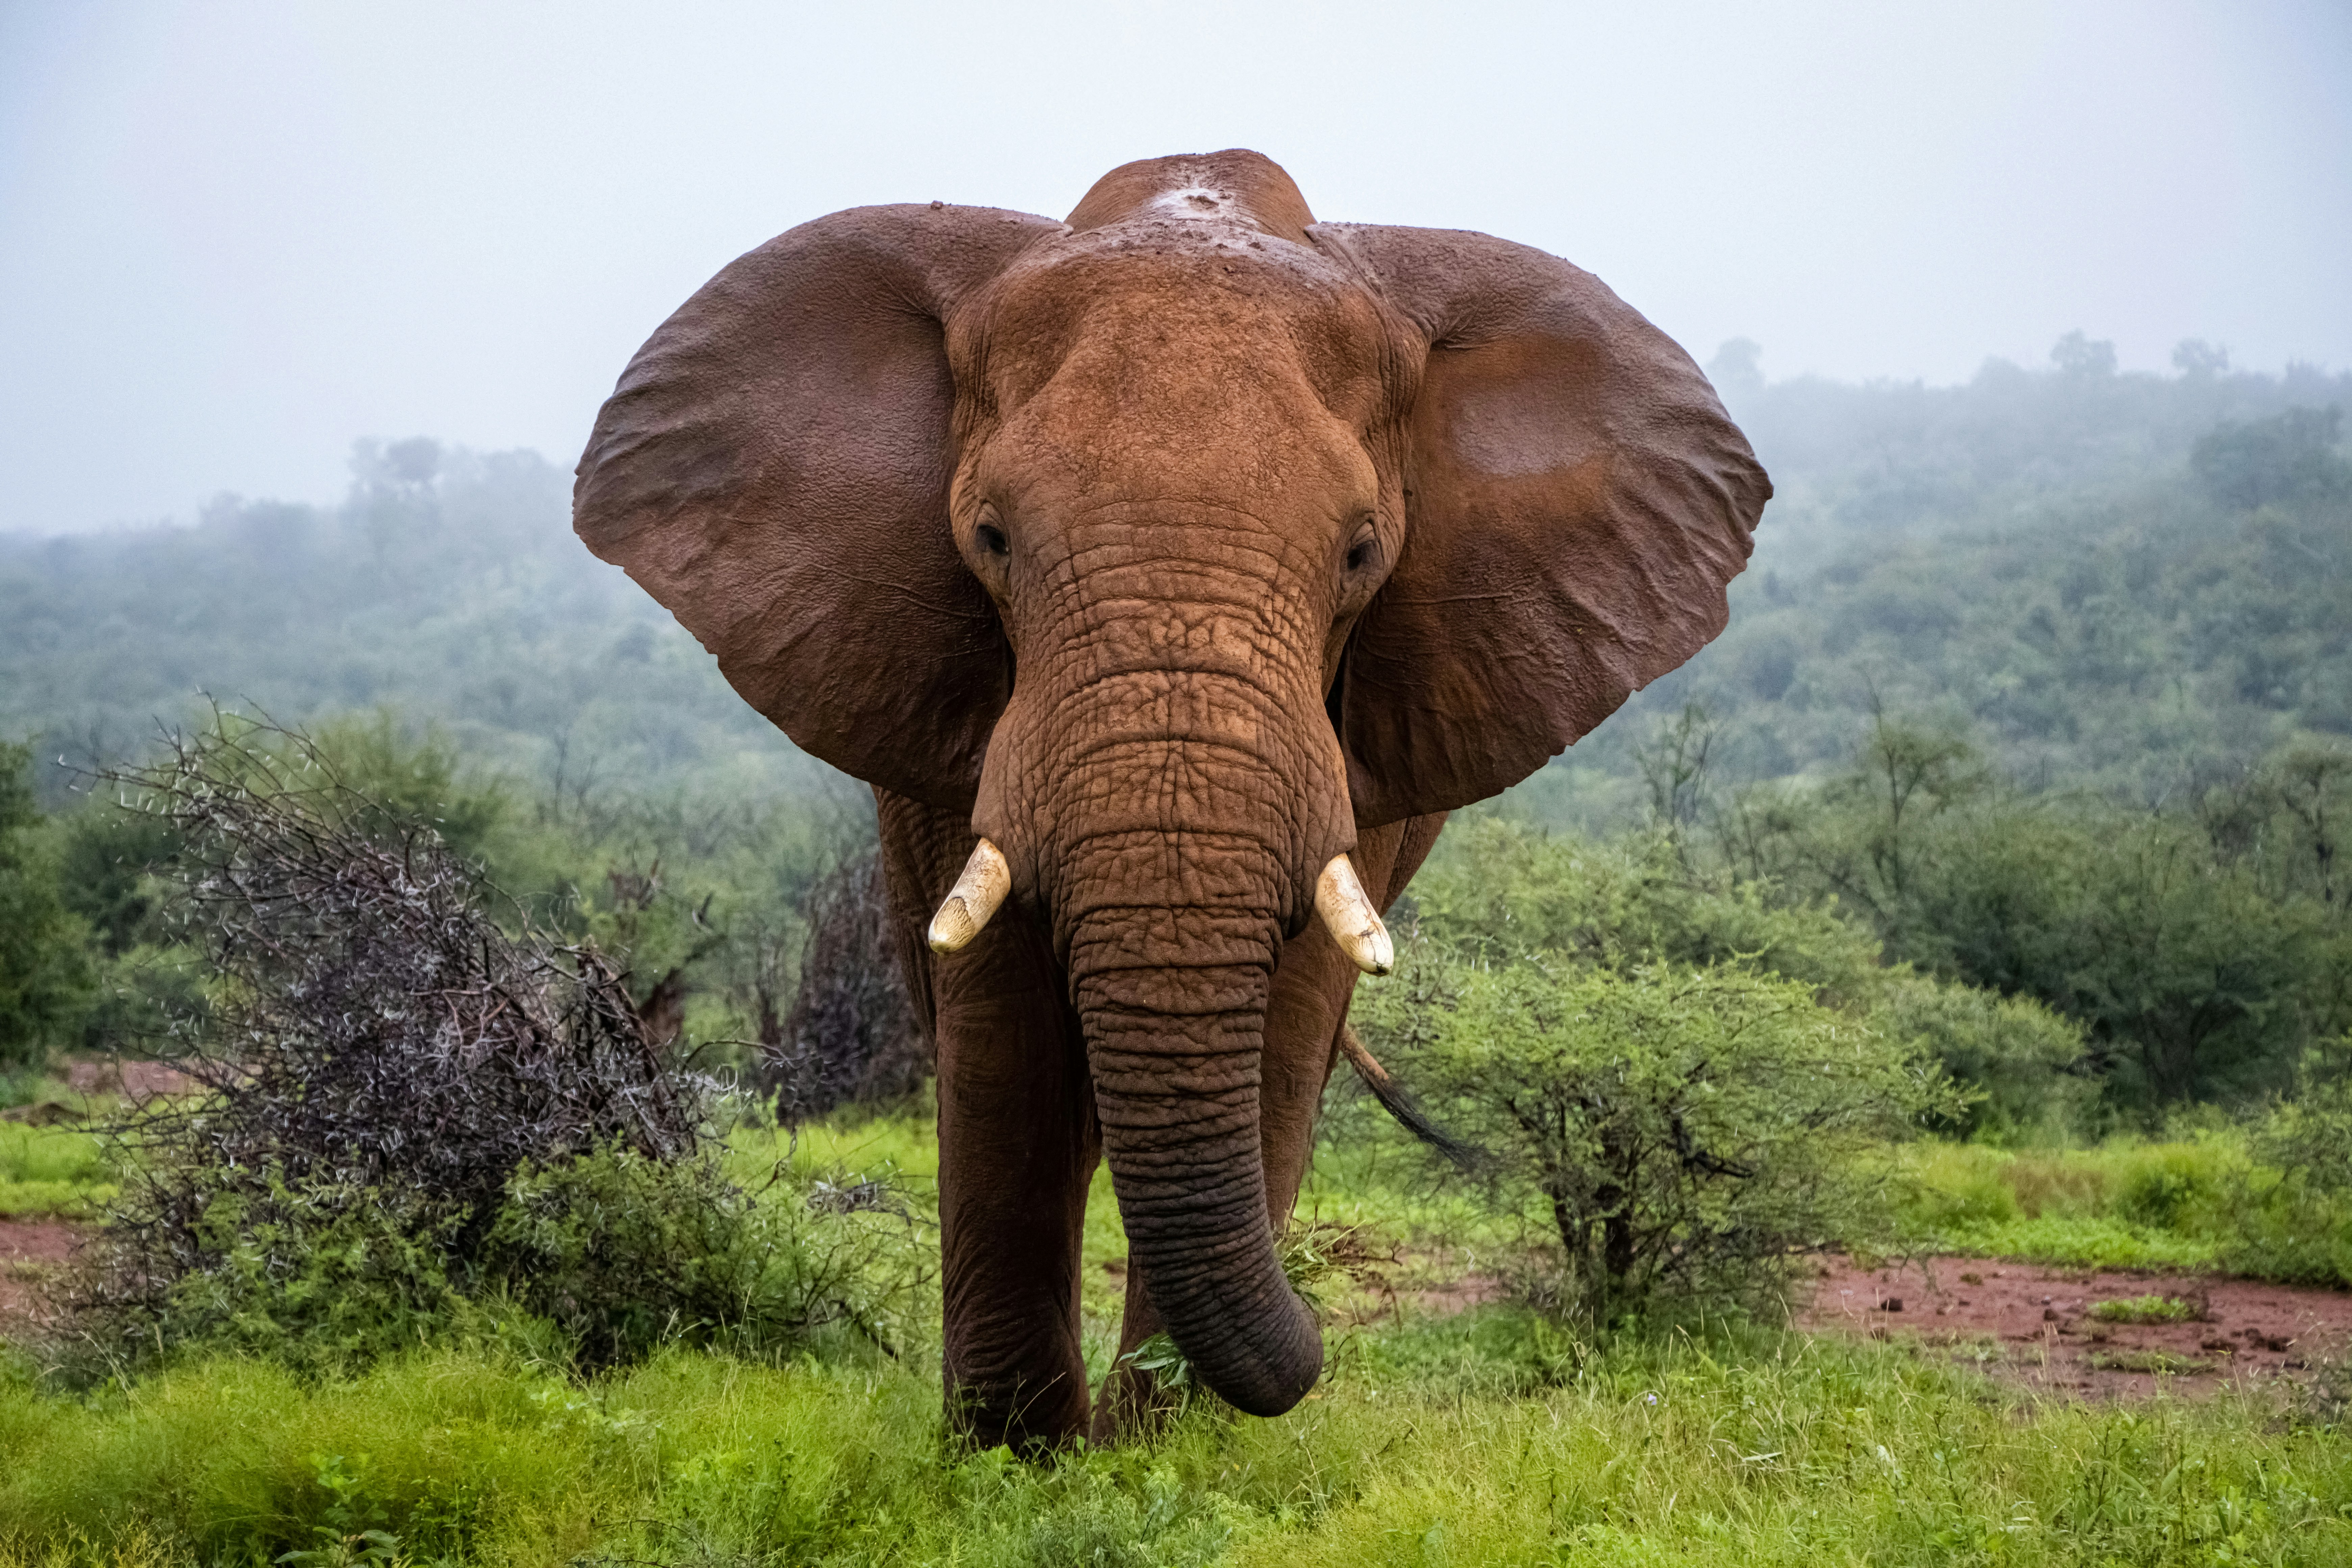
Every year an estimated 12,000 African elephants are killed for their ivory, and anti-poaching efforts depend on knowing where herds actually are so rangers can be allocated efficiently. Satellite imagery and physical tagging both fall short: satellites can't see through forest canopy, and tagging requires invasively capturing each animal. A promising alternative is scattering low-power acoustic sensor networks through the forest floor to passively detect and triangulate elephants using their own communication patterns.
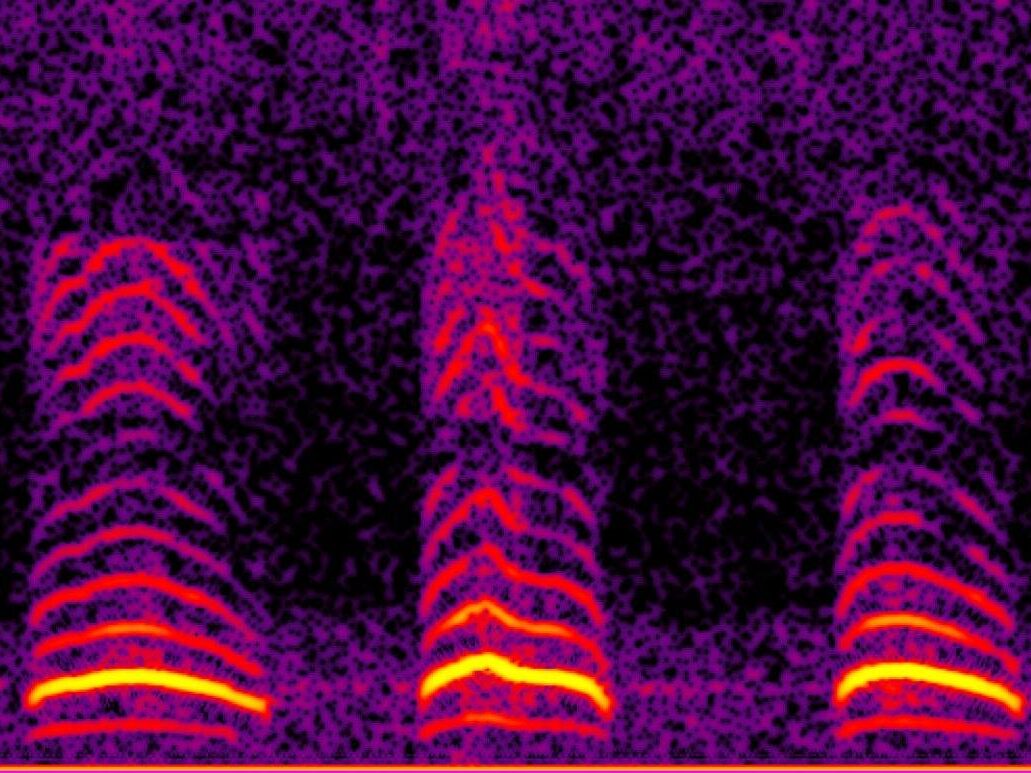
This project, done in collaboration with Cornell's Elephant Listening Project (ELP) and the CSU Chico Sensor Fusion research group, builds a deep learning detector for elephant "rumbles," the low-frequency vocalizations elephants use to communicate over several kilometers through the near-infrasound range (0-200 Hz). Because that range mostly cuts through dense foliage where audible-range sound and camera traps fail, acoustic detection in this band is one of the few reliable ways to sense elephants at distance in a forest environment.
The work happened in two phases: confirming which architecture, CNN or RNN, detects rumbles reliably, then optimizing the winning CNN for edge deployment.
How it works
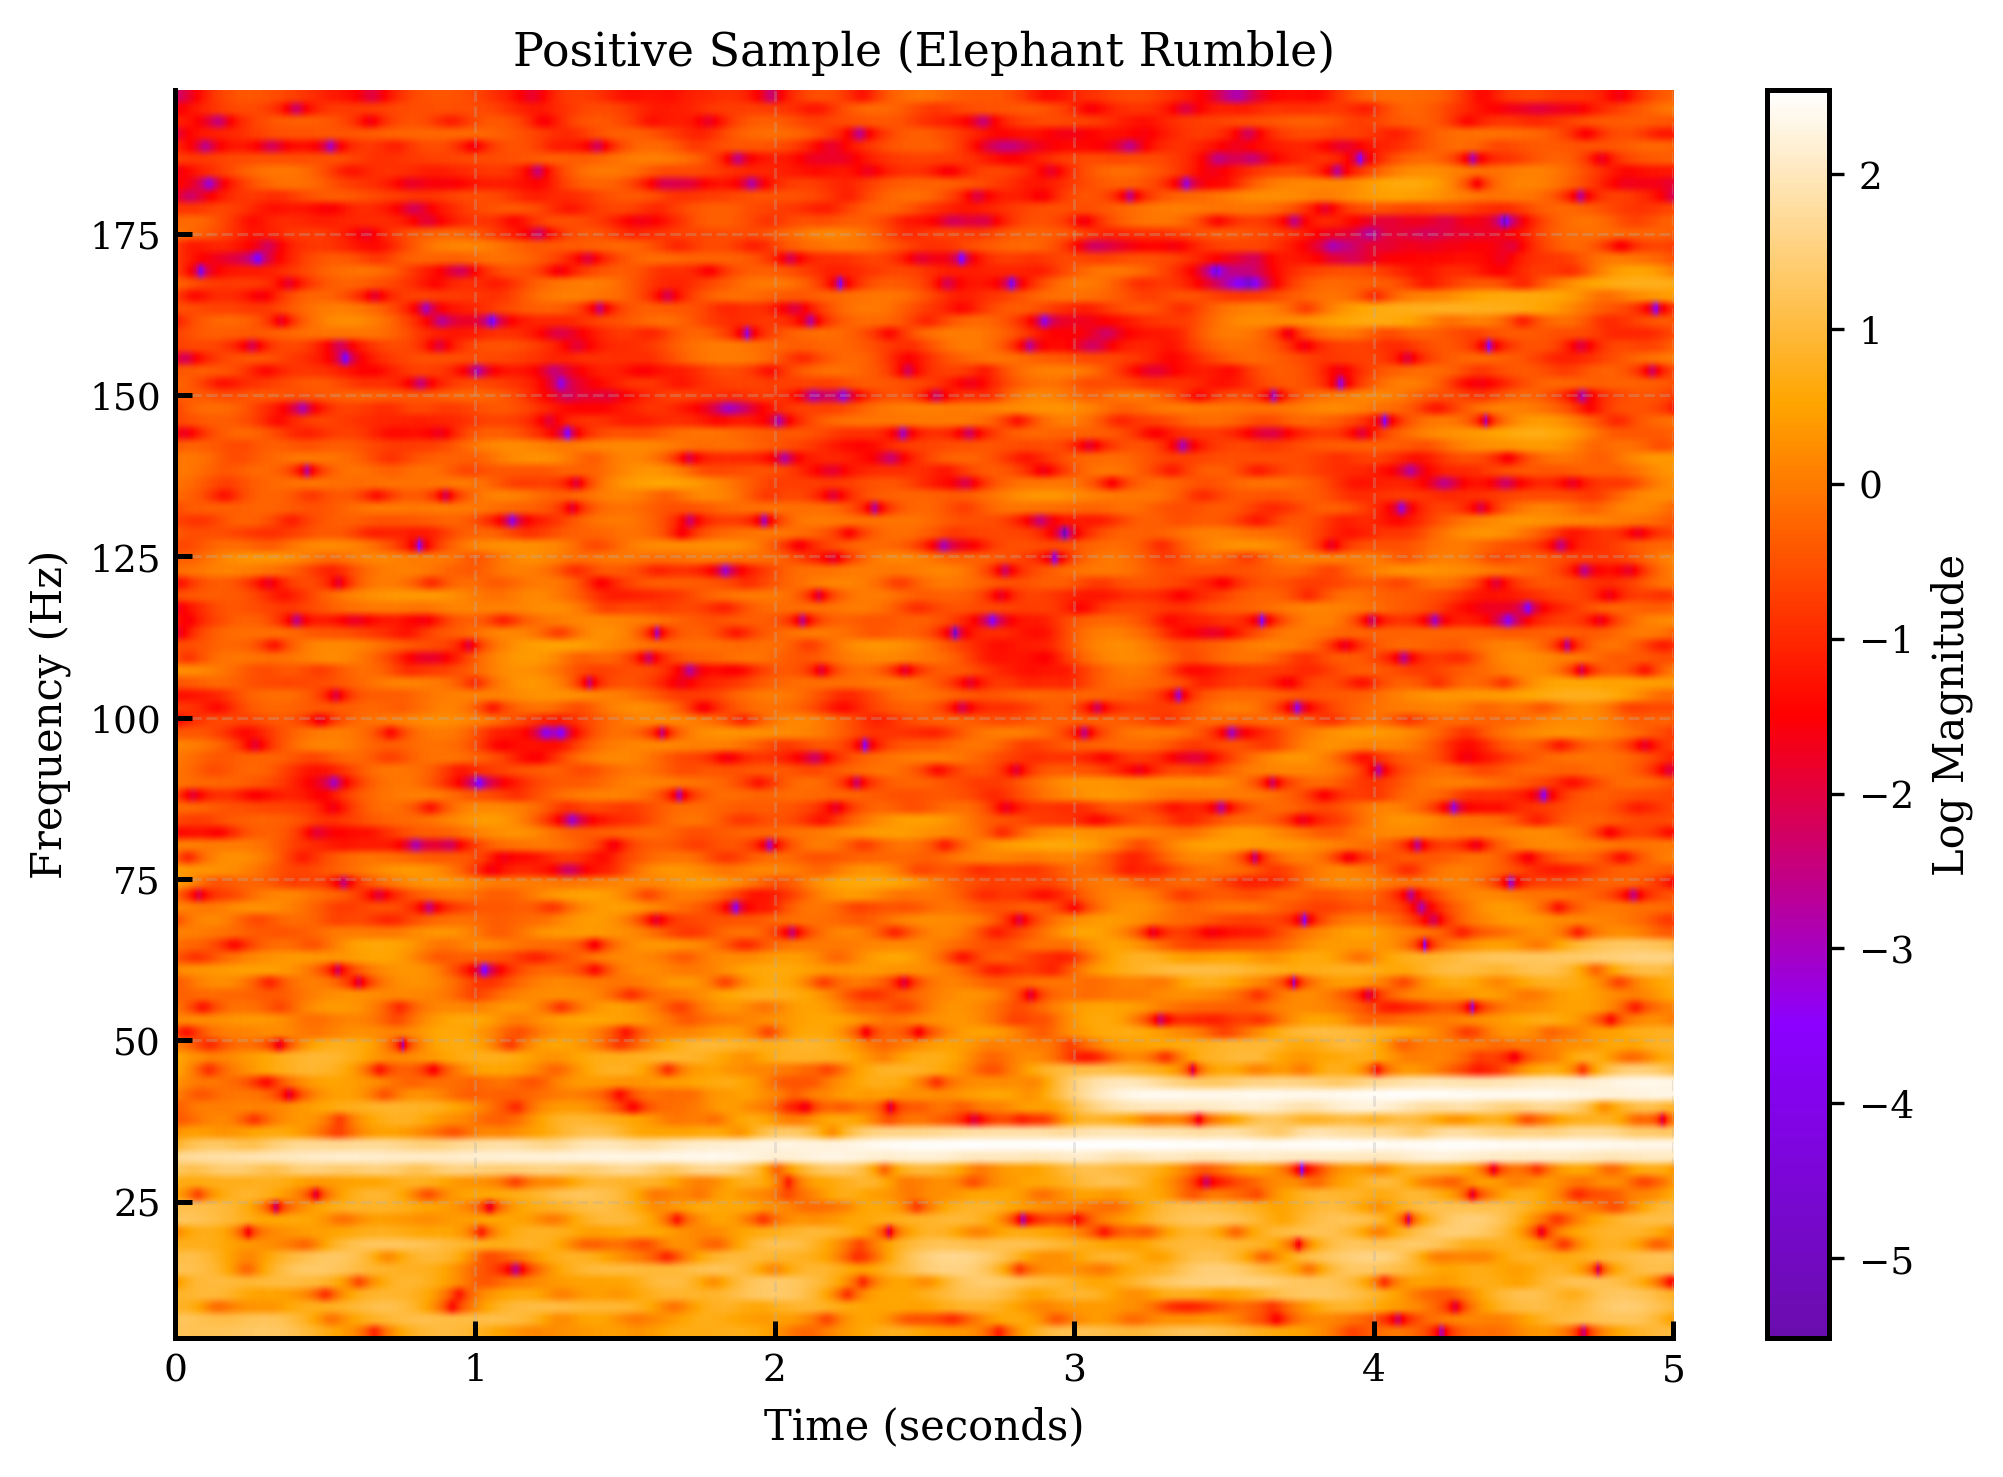
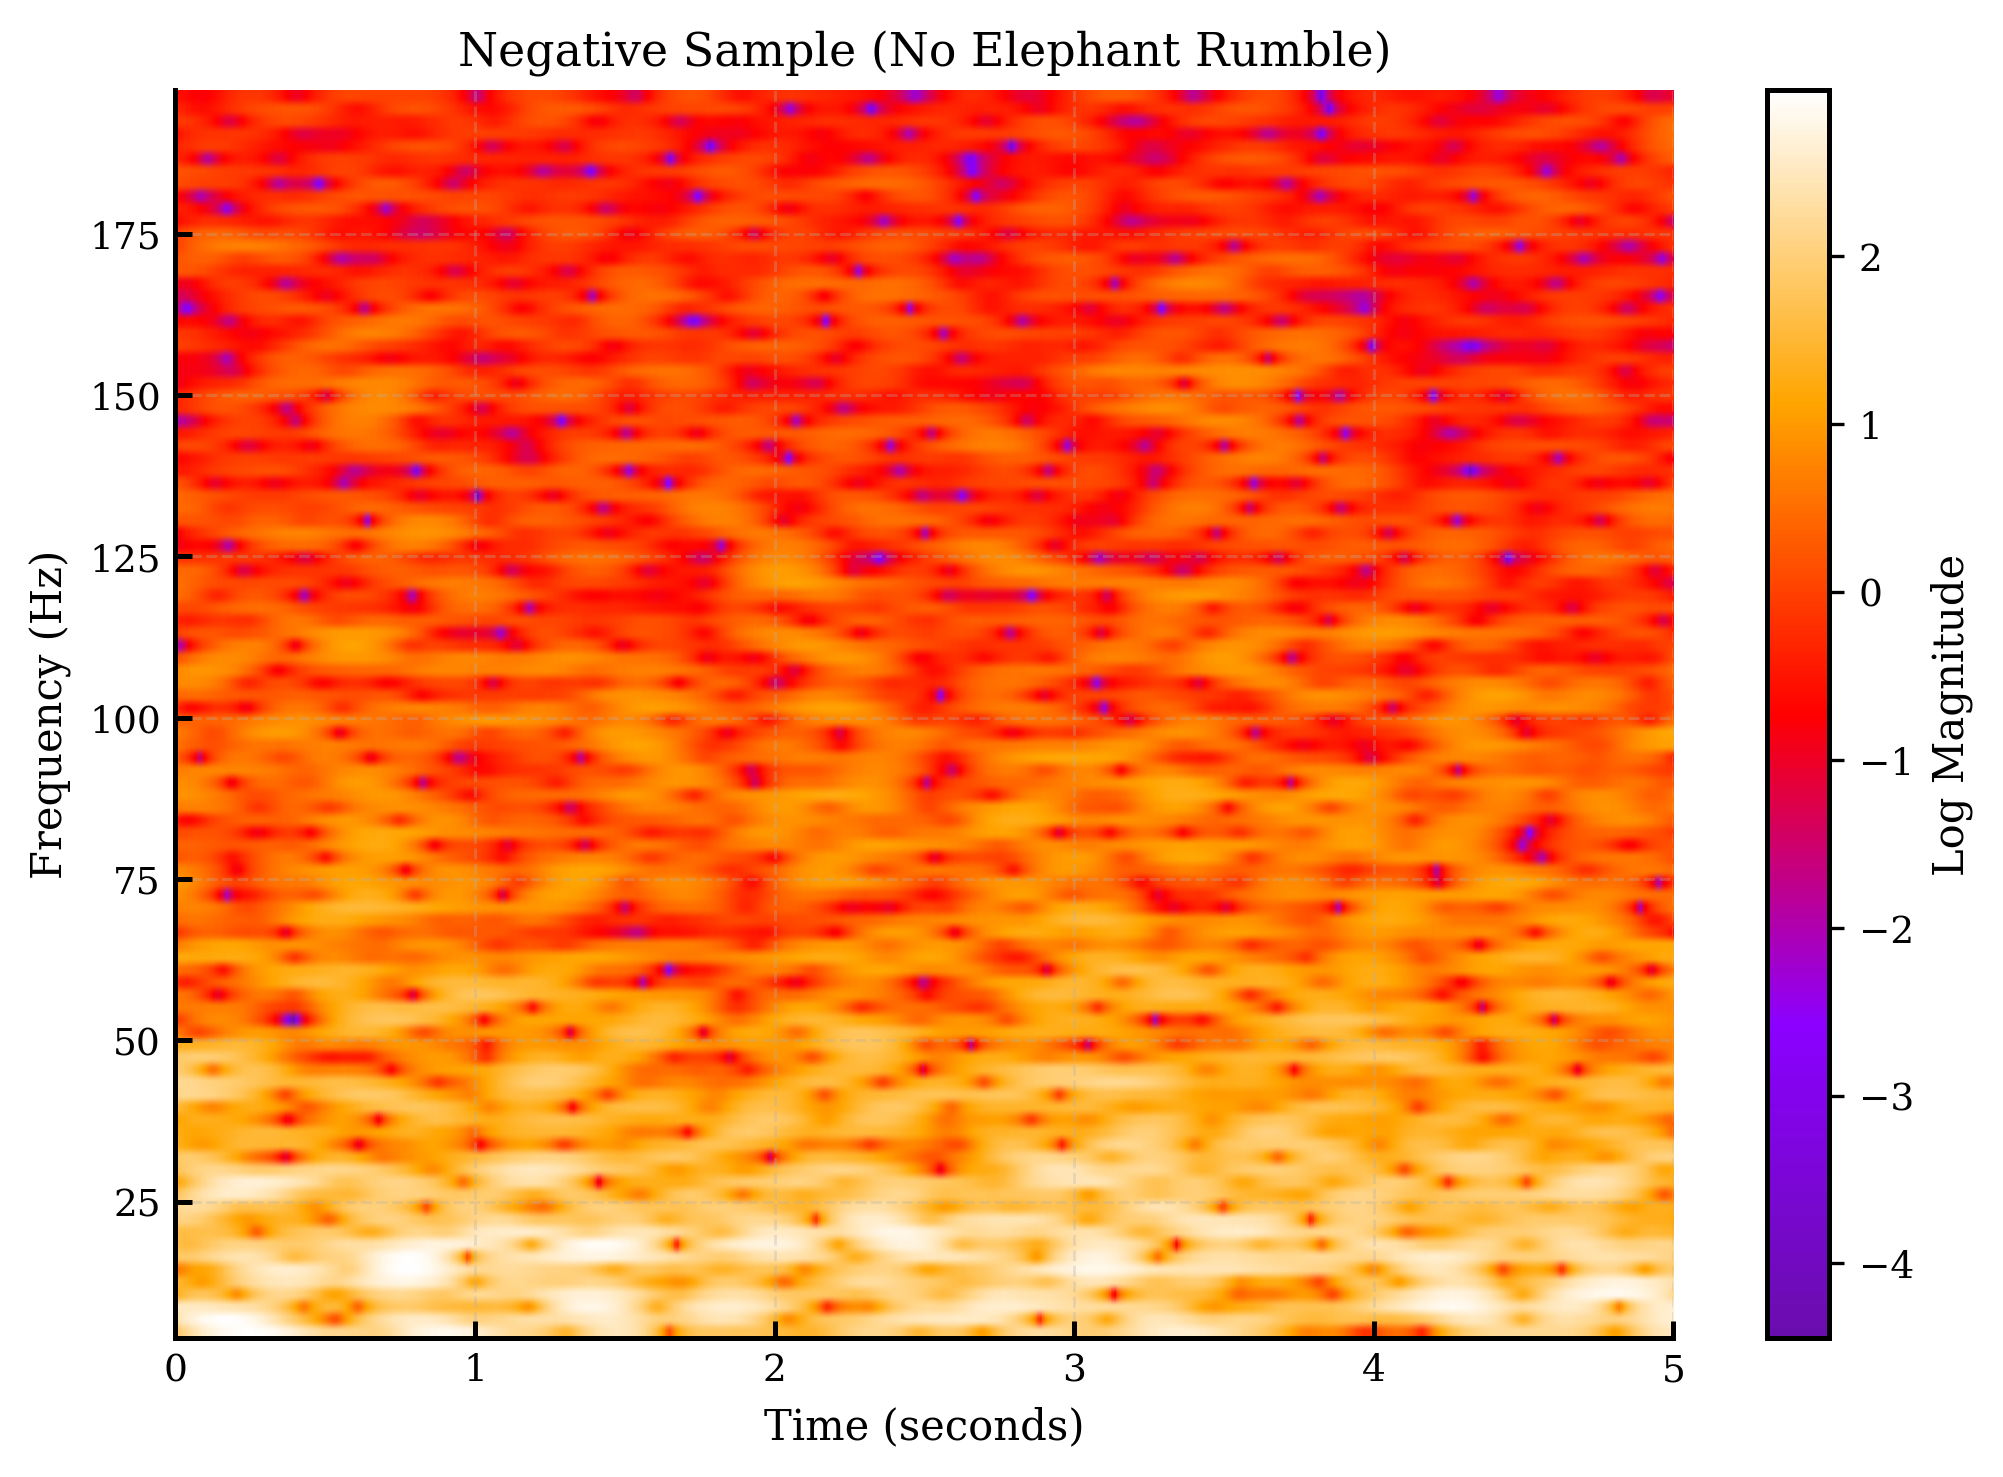
Signal pipeline. Raw 24-hour recordings from Cornell's Swift ARU field recorders (mixed 4/8 kHz, 16-bit) are resampled to a uniform 4 kHz, comfortably above Nyquist for the 0-200 Hz rumble band while giving one consistent rate across a dataset that arrived at several different native sample rates. Clips are cut to a fixed 5 seconds, a length chosen from empirical analysis of rumble bounding-box durations, so both the CNN and RNN could be fed identically shaped input for a fair architecture comparison, at the cost of truncating the rare longer rumble. Each clip is converted to a spectrogram with an STFT (2048-sample Hann window) band-limited to 0-200 Hz, the range that contains the elephant rumble's fundamental frequency and harmonics. The 2048-sample window was chosen over the smaller 512-sample window Raven Pro (the field-standard bioacoustics tool) defaults to, since the wider window resolves the rumble's low-frequency structure far more clearly in that band.
| Positive sample (rumble present) | Negative sample (no rumble) |
|---|---|
 |  |
Phase 1: CNN vs. RNN. The CNN takes the spectrogram as image input through a ResNet50 backbone; the RNN takes the raw waveform directly through a hierarchical two-layer LSTM (128 units, then 64 units), avoiding the STFT step entirely.
| CNN (spectrogram input) | RNN (raw waveform input) |
|---|---|
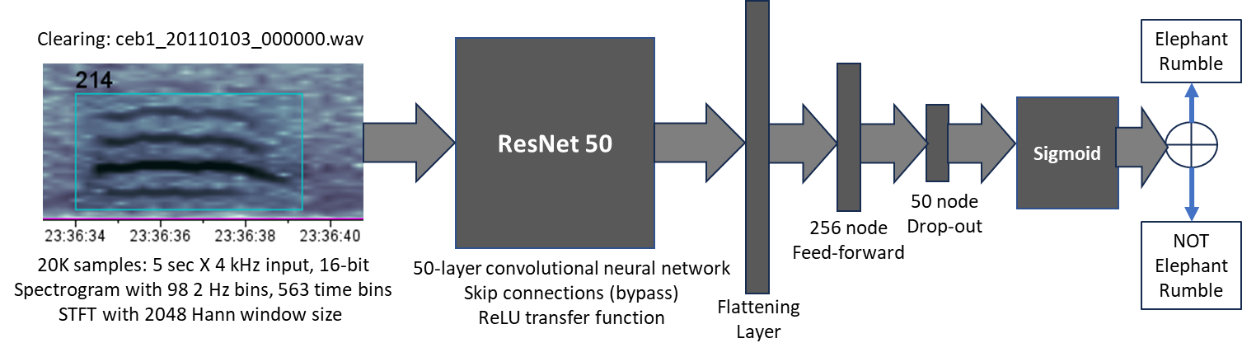 | 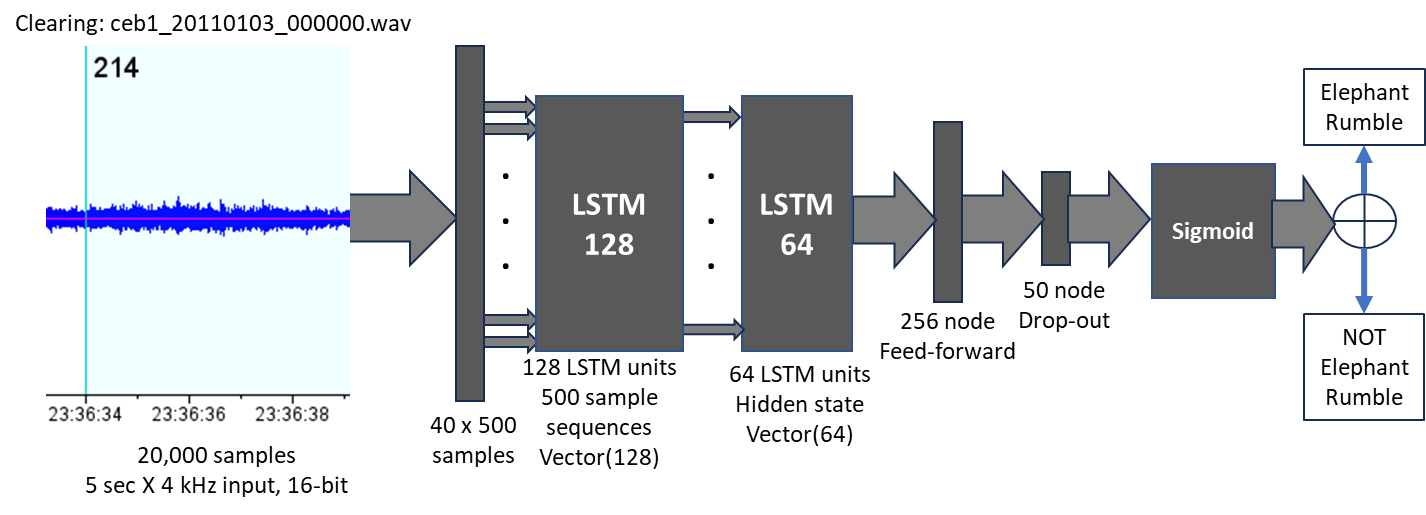 |
Across four trials of increasing scale, the CNN consistently outperformed the RNN, and the gap widened as the test set grew. On the final independent Dzanga test set (21,400 samples from a different location and time period than training), the CNN held up while the RNN's ROC curve dropped below the random-guess diagonal, a clear sign it had overfit to the smaller training distribution rather than learning the actual rumble signature. This settled the architecture question in favor of spectrogram-based CNNs.
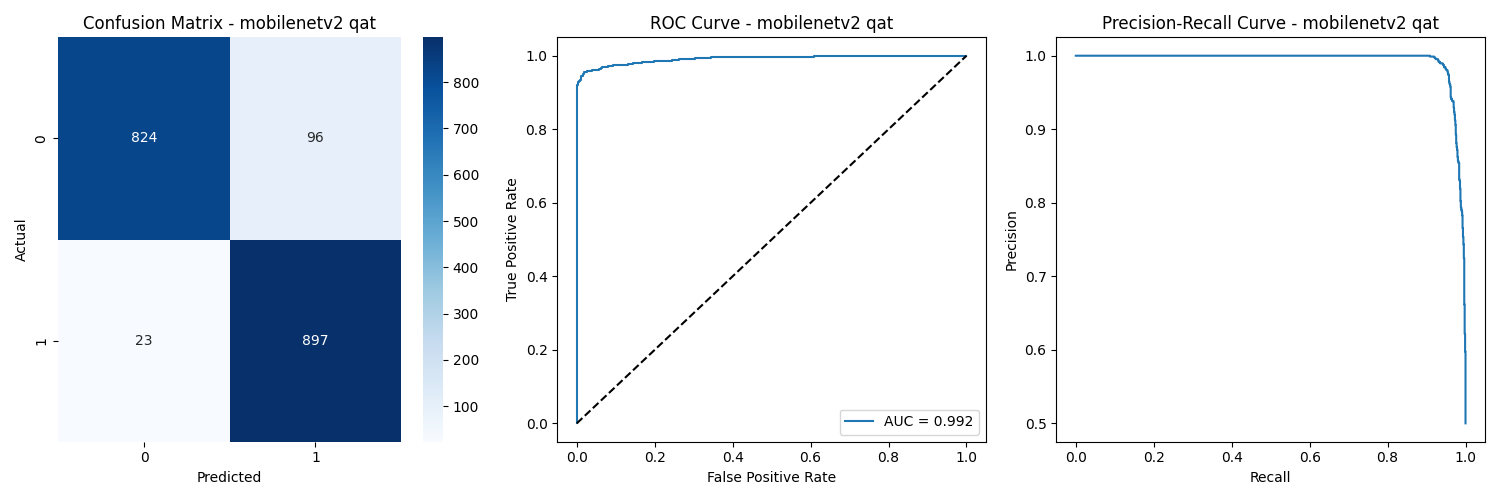
Phase 2: quantization for edge deployment. With the CNN direction confirmed, the second phase asked a deployment question: which CNN backbone, and which quantization strategy, gets the smallest model without losing accuracy? MobileNetV2 and ResNet18 were each trained three ways, as a full-precision baseline, with Post-Training Quantization (calibrated on 500 samples, FP32 to INT8), and with Quantization-Aware Training (which simulates INT8 constraints during training itself). Hyperparameters for every configuration came out of a 5-fold cross-validation search using Optuna's Tree-structured Parzen Estimator, rather than manual tuning.
MobileNetV2 beat ResNet18 in every configuration, largely because its inverted-residual linear bottlenecks are inherently more robust to the precision loss that quantization introduces:
Results
| Model | Method | Accuracy | Size | Reduction |
|---|---|---|---|---|
| MobileNetV2 | Regular | 98.8% | 9.78 MB | - |
| MobileNetV2 | PTQ | 98.7% | 2.41 MB | 4.05x |
| MobileNetV2 | QAT | 99.2% | 2.48 MB | 3.94x |
| ResNet18 | Regular | 95.0% | 43.2 MB | - |
| ResNet18 | PTQ | 94.7% | 10.8 MB | 4.00x |
| ResNet18 | QAT | 98.6% | 10.8 MB | 3.99x |
(Accuracy shown on the independent Dzanga test set.)
This project's Phase 1 results were peer-reviewed and published in SPIE, co-authored by me: A Comparison of Machine Learning Multiband Sensor Fusion Models for Detection of Central African Forest Elephants to Prevent Poaching.
Drafted with AI assistance from the project's repo, reviewed and edited by me.